Global Search for Power BI — Technical Deep Dive
Technical blog article, audience: developers, analysts, and data architects working with Power BI.
The real problem: cross-table search in dimensional models
Power BI reports grow in complexity proportional to the maturity of the data model. A well-designed star schema can easily have 15, 20, or more dimensions relevant to the end user: customers, products, regions, categories, statuses, sales reps, cost centers, internal references, and SKUs.
The problem isn't the model. The problem is that Power BI doesn't natively offer a cross-column search mechanism across distinct tables. The user needs to understand the model structure to know where to look for a specific value.
What exists natively
Power BI provides an internal search field in the filter pane, but it operates within a single field at a time and is not exposed as a UI element on the report canvas. The native slicer has text search, but it is equally restricted to a single column.
The most common workarounds, and their real costs
When a developer needs to simulate multi-field search in Power BI without a dedicated visual, the most common approaches are:
1. Stack of slicers with individual search The simplest approach: one slicer per relevant column, all with the search field enabled. Works for two or three fields. Beyond that, it takes up excessive canvas space, forces the user to know which slicer to search, and offers no unified experience.
2. Field Parameters + DAX + Bookmarks The approach considered more "correct" for those seeking dynamism. The typical flow is:
- Create a Field Parameter that groups the searchable columns
- Write dynamic DAX filtering measures based on the parameter selection
- Create a slicer over the parameter for the user to choose which field to search
- Add a second slicer (or text field via Q&A) for the value
- Tie everything together with bookmarks and navigation buttons to create the illusion of a unified experience
The result is usually fragile. Any renaming of a table or column can silently break the DAX measures. Maintenance becomes costly. The experience still isn't free-form search, as the user still needs to choose the field before typing the value.
3. Unpivot in Power Query Another approach that appears frequently is using Power Query to unpivot the searchable columns into an attribute-value table, consolidating everything into a single "Value" column accompanied by a "Field" column.
The problem is structural: the unpivot denormalizes the model. Row count can explode (N columns × M original rows). Relationships with other tables need to be rebuilt or duplicated. Measures that depend on the original granularity stop working correctly. It's a search solution that compromises model integrity.
4. Q&A Visual Power BI's Q&A visual uses natural language, but depends on manually configured synonyms, has unpredictable behavior in non-English languages, and offers no control over which fields will be searched. It's not suitable for corporate environments that require predictability.
What Global Search does differently
Global Search is a visual that solves the cross-table search problem directly, without altering the data model and without requiring additional DAX.
Filter architecture
The visual receives up to 25 columns through a single data role (searchFields, of type Grouping). In each update() cycle, it reads the rows from the flattened table (dataView.table.rows) and indexes unique values per column.
Filters are applied through the IVisualHost.applyJsonFilter API, using BasicFilter with the In operator — that is, one filter per active column. This means filters propagate through the model just like any other Power BI filter, respecting relationships, row-level security (RLS), and all visuals on the page.
Table name decoupling
A critical implementation detail is that Power BI freezes the queryName of each column at binding time. If the user renames the table in the model after connecting the fields, the queryName becomes stale and filters silently stop working.
Global Search solves this by using col.expr as the source of truth:
const expr = (col as any).expr;
const tableName = expr?.source?.entity || col.queryName?.split('.')[0];
const columnName = expr?.ref            || col.queryName?.split('.')[1];
On every update(), the visual compares active fields against applied filters, automatically detects renames, and reapplies filters with the correct names — without user intervention.
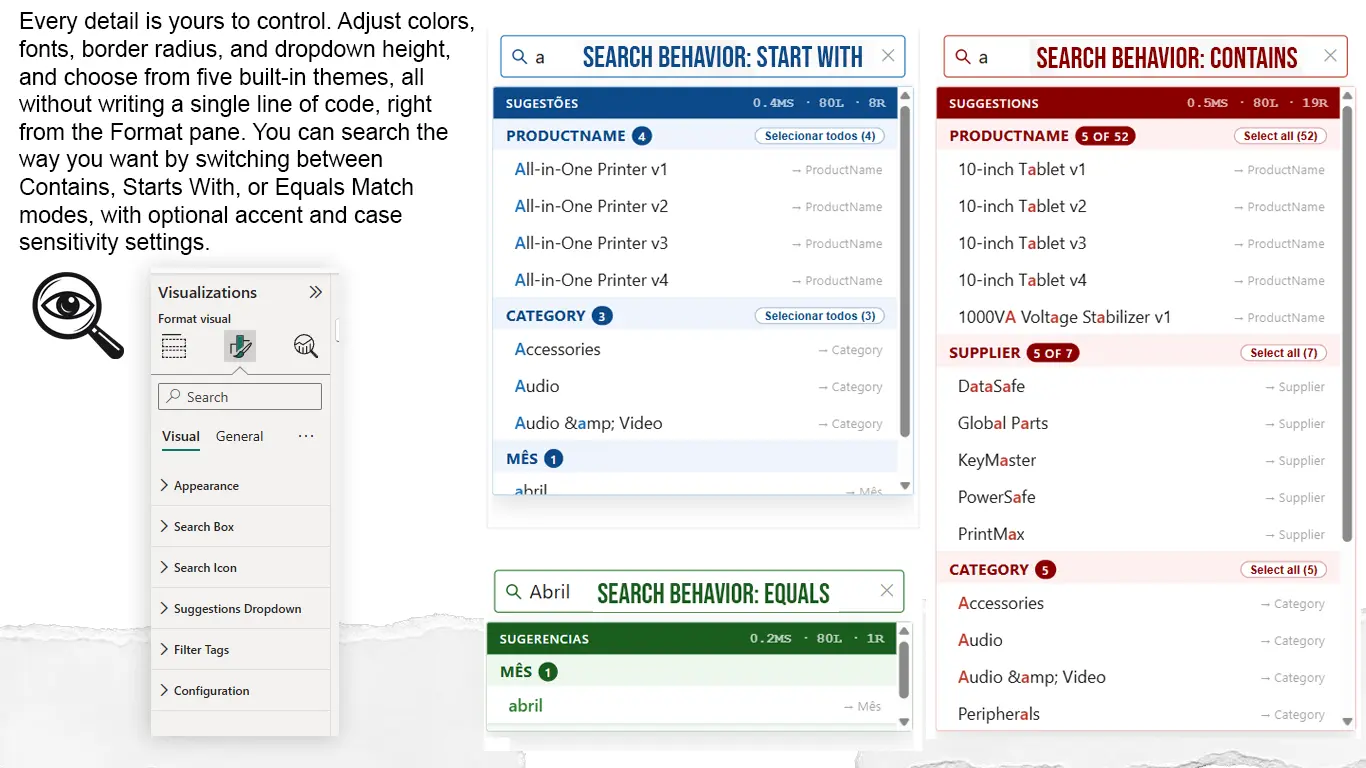
Search modes
Configurable in the Format Pane:
| Mode | Behavior |
|---|---|
| Contains | Matches at any position in the value (default) |
| Starts With | Matches only the beginning of the value |
| Equals | Exact match |
In addition to the mode, the developer can independently configure:
- Ignore Accents — normalizes Unicode characters before comparison (
é=e) - Case Sensitive — distinguishes uppercase from lowercase (disabled by default)
Suggestions grouped by field
The dropdown displays results organized by source column, with a group header showing the field name and an X of Y counter (translated per the configured language). Each group has a "Select all" button that applies all visible values for that field with a single click, equivalent to Ctrl+clicking each item individually.
Active filters as tags
Applied filters appear as removable tags below the search field. Each tag can optionally show the source field name (showFieldName), allowing the user to understand where each filter came from and remove them individually or all at once.
Performance
The visual operates entirely client-side, with no external calls. Value indexing happens on data arrival (update()), and suggestion filtering is synchronous, ensuring immediate response while typing.
The Format Pane exposes a Show Metrics option (diagnostic mode) that displays processing time and the volume of indexed data — useful during report development.
The dataReductionAlgorithm is configured for up to 50,000 rows per query, sufficient for most lookup scenarios, with on-demand loading beyond 50,000.
Accessibility
- Full keyboard navigation:
Tabto move between elements,Enterto select, andEscapeto close the dropdown - ARIA attributes on all interactive elements:
role,aria-label,aria-expanded,aria-selected, andaria-livefor dynamic announcements - Labels translated per the configured language
- Configurable contrast via Format Pane
Internationalization
Three languages are supported: Portuguese (BR), English, and Spanish. Detection is automatic via navigator.language, with the option for manual override in the Format Pane. All UI strings are externalized — no hardcoded text in the rendering code.
Customization via Format Pane
The visual exposes a broad set of native Power BI properties, with no external configuration needed.
Search Box: background color, text color, border color (default and focus), font size and family, border radius, height, search icon (color, size, and visibility), and clear button (size).
Suggestions Dropdown: item font color and size, header background color, header text color, hover color, match highlight color, maximum dropdown height, maximum results per field, and group label font size.
Filter Tags: background color, text color, font size, and field name visibility.
Pre-defined themes: Black & White, Red, Blue, Mustard, and Green. Each theme applies a coherent set of color tokens with a single click and can be further refined property by property.
Comparison with other market visuals
The table below compares Global Search with alternatives available on AppSource that address text search or filtering.
| Feature | Global Search | Native Slicer | Smart Filter Pro (OKViz) | Advanced Slicer (xViz) | Q&A Visual |
|---|---|---|---|---|---|
| Search across multiple fields at once | Yes (up to 25) | No | No (1 per instance) | No (1 per instance) | Partial |
| Suggestions grouped by field | Yes | No | No | No | No |
| Select all per group | Yes | No | No | No | No |
| Active filters visible as tags | Yes | No | Yes | Yes | No |
| Configurable search modes | Yes (3 modes) | No | Partial | Partial | No |
| Accent normalization | Yes | No | No | No | No |
| ARIA + keyboard accessibility | Complete | Partial | Partial | Partial | Partial |
| Internationalization (PT/EN/ES) | Yes | No | No | No | No |
| Granular customization via Format Pane | High | Low | Medium | Medium | Low |
| Pre-defined themes | Yes (5) | No | No | No | No |
| Performance metrics (diagnostic) | Yes | No | No | No | No |
| No data collection | Yes | N/A | Not confirmed | Not confirmed | N/A |
| Free without restrictions | Yes | Yes | No (paid) | No (paid) | N/A |
Information about third-party visuals is based on publicly available documentation on AppSource and vendor websites. Subject to change with product updates.
What's coming next
Features documented and under evaluation for upcoming versions.
Multi-token search with ;
Allow the user to type product;2026 and apply both terms as cascading filters. Each token narrows the context for the next. The cascade logic already exists in the current architecture — this feature is an extension of the filtering pipeline.
Dropdown on focus without typing
When clicking the field without typing, display all unique values grouped by field, like a native select. This is a direct extension of renderSuggestions(), treating an empty query as "show all", with a separate configurable limit from the search maxResults.
Field type icons
The fieldType is already detected and stored in each FieldData and Suggestion. The implementation is purely rendering: adding the icon (Aa, 123, calendar) to the HTML of each suggestion. The pending challenge is reliable date detection, as the col.type.dateTime field from the Power BI API isn't always populated correctly depending on the data source.
Frequency-based sorting
Instead of alphabetical sorting, display first the values that appear most frequently in the indexed rows. This requires a change in renderSuggestions() logic and an evaluation of the performance impact on large datasets. It will be configurable via Format Pane as an alternative to alphabetical ordering.
Conclusion
Global Search doesn't replace a well-designed data model. It solves a specific problem that Power BI doesn't cover natively: giving the end user a single entry point to locate any value in any field of the model, without requiring knowledge of the report structure.
It's free, with no data collection and no external dependencies. The code is fully isolated within the visual environment — no network calls, no third-party SDKs, no telemetry.
Available on AppSource for immediate use in any Power BI report.
If you find it useful, please consider leaving a positive review 😁